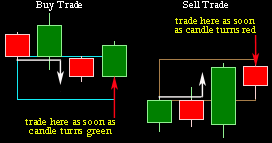
Image 5, shows the complete Cevn-Boxx strategy. The blue and tan rectangles are the Cevn Boxx. The white arrow indicates the candlestick pattern. The red arrow indicates the trade candle and where to place your trade.
As soon as price passes the opening price in the trade direction is when the wager is placed. The direction of the trade is can always be found by the colour of the Boxx's.
-
A Tan Boxx indicates a Sell trade.
-
A Blue Boxx indicates a Buy trade.

Image:5
The fourth and final candle is known as the 'Trade Candle'. The trade candle is not part of the candlestick pattern it is as the title suggests the candle we trade on.
TRADE CANDLE

Image 6, shows the complete Cevn-Boxx strategy again, but now with the trade candle outside the Boxx. It does not matter where the trade candle appears on the timeline it can appear either inside or outside the Boxx.
Image:6