PRIVATE FOREX TRADING FIRM
Cevntun Trading Partners
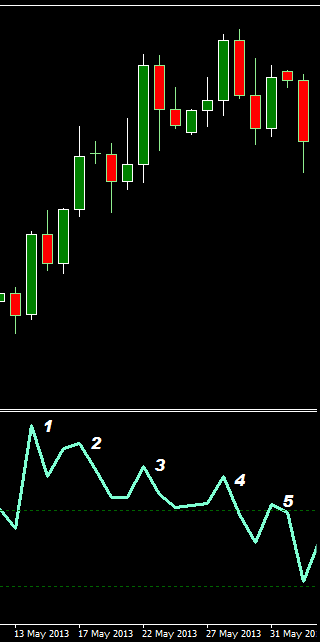
This image shows multi Set-up and Retest pairs
-
Peak 1 is New Set-up peak.
-
Peak 2 is a retesting of peak 1 but then becomes the Set-up for peak 3.
-
Peak 3 is a retesting of peak 2 but then becomes the Set-up for peak 4.
-
Peak 4 is a retesting peak of 3 but then becomes the Set-up for peak 5.
-
Peak 5 is a retesting peak of 4.
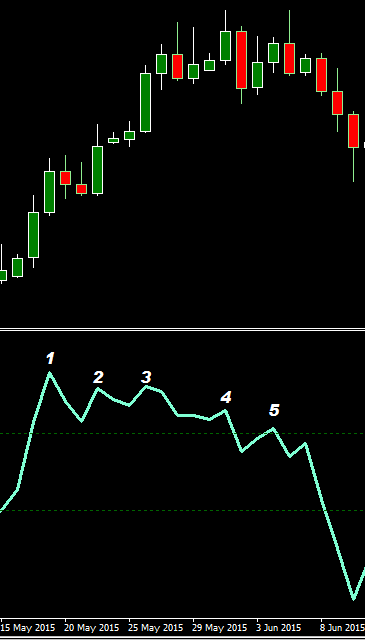
In the next image we see another set of Set-up-Retest pairs but there is one important difference, peak 3 is higher than peak 2. This simply means that peak 2 cannot be a Set-up for peak 3. The strategy simply ignores peak 2 and restarts the trading strategy on peak 3.
-
Peak 1 is New Set-up peak.
-
Peak 2 is a retesting of peak 1 but then becomes the Set-up for peak 3.
-
Peak 3 is a retesting of peak 2 but it goes higher making peak 2 void as a Set-up.
-
The current trading ends at peak 2. Then begins again with peak 3.
-
Peak 4 is a retesting peak of 3 but then becomes the Set-up for peak 5.
-
Peak 5 is a retesting peak of 4 but then becomes the Set-up for peak.
Multiple Set-up-Retest peaks can only form above the +70 line or below the -70 line. What happens inside these Level Lines will be explained later.
This image shows multi Set-ups and Retest pairs but with a voided Set-up at 3

Retesting the Set-ups
The logic behind the trading strategy is quite simple, it is the retesting of the possible end of a trend or a simple cut back indicated by the CCI indicator. This retesting creates high probability low risk trading opportunities.
The first peak indicates that momentum has slowed and the current trend may be coming to an end. The second peak is confirmation that the momentum has slowed and turned predicting that price action is also expected turn, if it has not already. This reversal maybe only have a short lifespan perhaps 1 or 2 candles before returning back to the original trend or it may indicate a complete reversal of the current trend.
Regardless of whether it's a cut back or a full reversal this predicting action indicates the possible high probability trades. It also shows that the CCI indicator can be employed as a leading/predictive indicator.
When a Set-up peak forms the strategy then waits until the CCI oscillator has a retesting of that peak. If the second peak is lower than the Set-up peak then we have the second component in the strategies objective.
The Second Component of the Trading Strategy
The image above shows how the first two components are formed by the oscillator
Over the Level Lines Retesting
There can be several Set-up-Retest pairs that are able form peaks above the +70 Level Lines or below the -70 Level Lines. This has the effect of creating a chain of Set-up-Retest peaks where the retesting peak becomes the Set-up peak for the next Retest peak. There is no limit to the number of these pairs of peaks as long as they abide to the rule sof the trading strategy the retesting peak must always be lower than the Set-up peak, except where peaks are level (explained later).
This retesting can form anywhere above or below the Level Lines. However, due to the way the strategy work this retesting is only possible a minimum of 2 days after the Set-up peak was first formed. However, there is no maximum number of days after the Set-up peak was formed before the next peak will form.
Don't let this become a worry as this will become much clearer when you have more experience with the trading strategy.