PRIVATE FOREX TRADING FIRM
Cevntun Trading Partners
The daily settings below are those used by the trading strategy to generate all the different trade types. Also the settings used to generate the returns that are used in the spreadsheets is listed below including a conservative effort to the calculate the pips won and therefore the total amount of profit the trading strategy could have generated by an experienced trader.
It should be noted that while the Strategy Settings governing the CCI and Stop Loss settings are part of the Cevn Bounce trading strategies general rules. The Trading Settings the 50% loss of maximum pips gained is not part of the strategies rules. It is used simply to enable a calculation of the results gained by the trading strategy to be displayed.
The returns given in the spreadsheet are subjective and may not represent the total pips/profit that you can achieve. An experienced trader will expect to make far more than the returns in the spreadsheet while a new trader will have difficulty making the spreadsheet amount.
These settings are generated on the Oanda MT4 platform which includes Sunday evening opening. While you may use any MT4 platform and service provider you will find that there are differences with the number of trades that are returned not using Sunday openings compared to those on this website. You may also discover that you have trades that are not given on the returns in the spreadsheet, you will also find that trades given on here may not be on your version of MT4. That being said you will find that the ratio of win/loss returns will be very similar across all MT4 platforms regardless of service provider.
There are two different CCI Indicators given with all MT4 platforms. You will find the indicator used with this trading strategy in the Oscillators section named Commodity Chanell Index.
The strategy uses only those trades produced by the Daily timeframe of Oanda. Using the strategy on lower timeframes can cause to much noise and therefore may not produce a similar ratio of winners to losers.
Strategy Settings
Timeframe: Daily
CCI Indicator Settings
-
Period: 14
-
Apply to: Close
CCI Level Lines:
-
Top Line 70
-
Bottom Line -70
Stop loss: 100 pips.
Stop Loss
The stop losses may seem very high to some traders, however you will find that in order to ensure the high ratio of winners to losers (90%+) that 100 pips for pair on the daily timeframe is just about the correct value.
Trade Exit
I have used the 50% loss of maximum winnings as the exit policy. For example if a trade gains a maximum of 50 pips the exit would if the trade returned to 25 pips. All exit policies have problems associated with them this exit policy has problems early in the life of the candle. For example when 10 pips gained moving the stop loss at this time can be quite dangerous to the trade as price could easily move 5 pips in one tick. My answer to this is to allow price to rise to say 15 or 20 pips before putting the 5 pip stop loss in place.
Trading
-
Extra high spreads used, taken from middle of night (these prices are higher than the normal as they are taken from when trading is light).
-
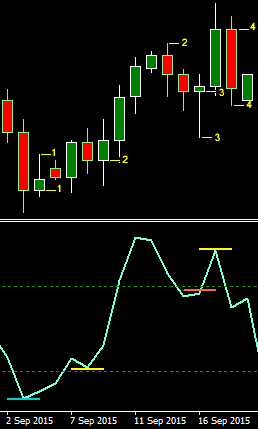
When a candle of the opposite colour is produced that is not a Spinning Top or a candle like a Doji then trading stops. See image below.
-
All the returns used in the spreadsheets are obtained by taking the highest amount of pips gained by each individual trade then dividing the results by half. So if a trade gained a maximum of 50 pips then the spreadsheet results would only use 25 pips.
System Settings
Before going any further I must reiterate that all the Returns/Pips gained used on the website and in the spreadsheets follow the trading format given above. This allows for a Returns/Pips gained policy to be given that is an actual acheivable assessment rather than just a truely hypothetical returns policy by using the final pips gained for each trade. As newbies and less aggressive traders are more than likely to take an early return price than the more experienced traders. By adopting this method we can set a standard that is eaily to follow but shows a conservative estimate of Returns/Pips gained that the trader can expect from the stratgey.
How the Candles are Traded to Obtain Returns for the Spreadsheet Only

In the bottom left hand corner of the image above a buy trade (1) developed on the EURUSD pair, Fri. 03 Sept. 2015. Trading ended the on the start of trading the following Sunday night as price closed down on the high of the first candle.
The next trade (2) appeared on the Fri. 03 September. Trading ended on the 14th September at the end of the trend and the appearance of a candle of the opposite colour. Although the buy trade ended on the 13th September we also include the wick of the next candle if this was formed before the price reversed directions.
Trade (3) shows why trading the 50% of the high gained is a good strategy. This candle reversed from a winning trade to a failed trade. So by taking 50% of high gained the trader close the trade with profit.
The final trade (4) is in the top right hand corner of the image above. This sell trade developed on the Fri. 18 Sept. 2015. Trading ended the very next day as the next candle was of the opposite colour and was not a Spinning Top or Doji.
This image shows how the candles are traded