PRIVATE FOREX TRADING FIRM
Cevntun Trading Partners

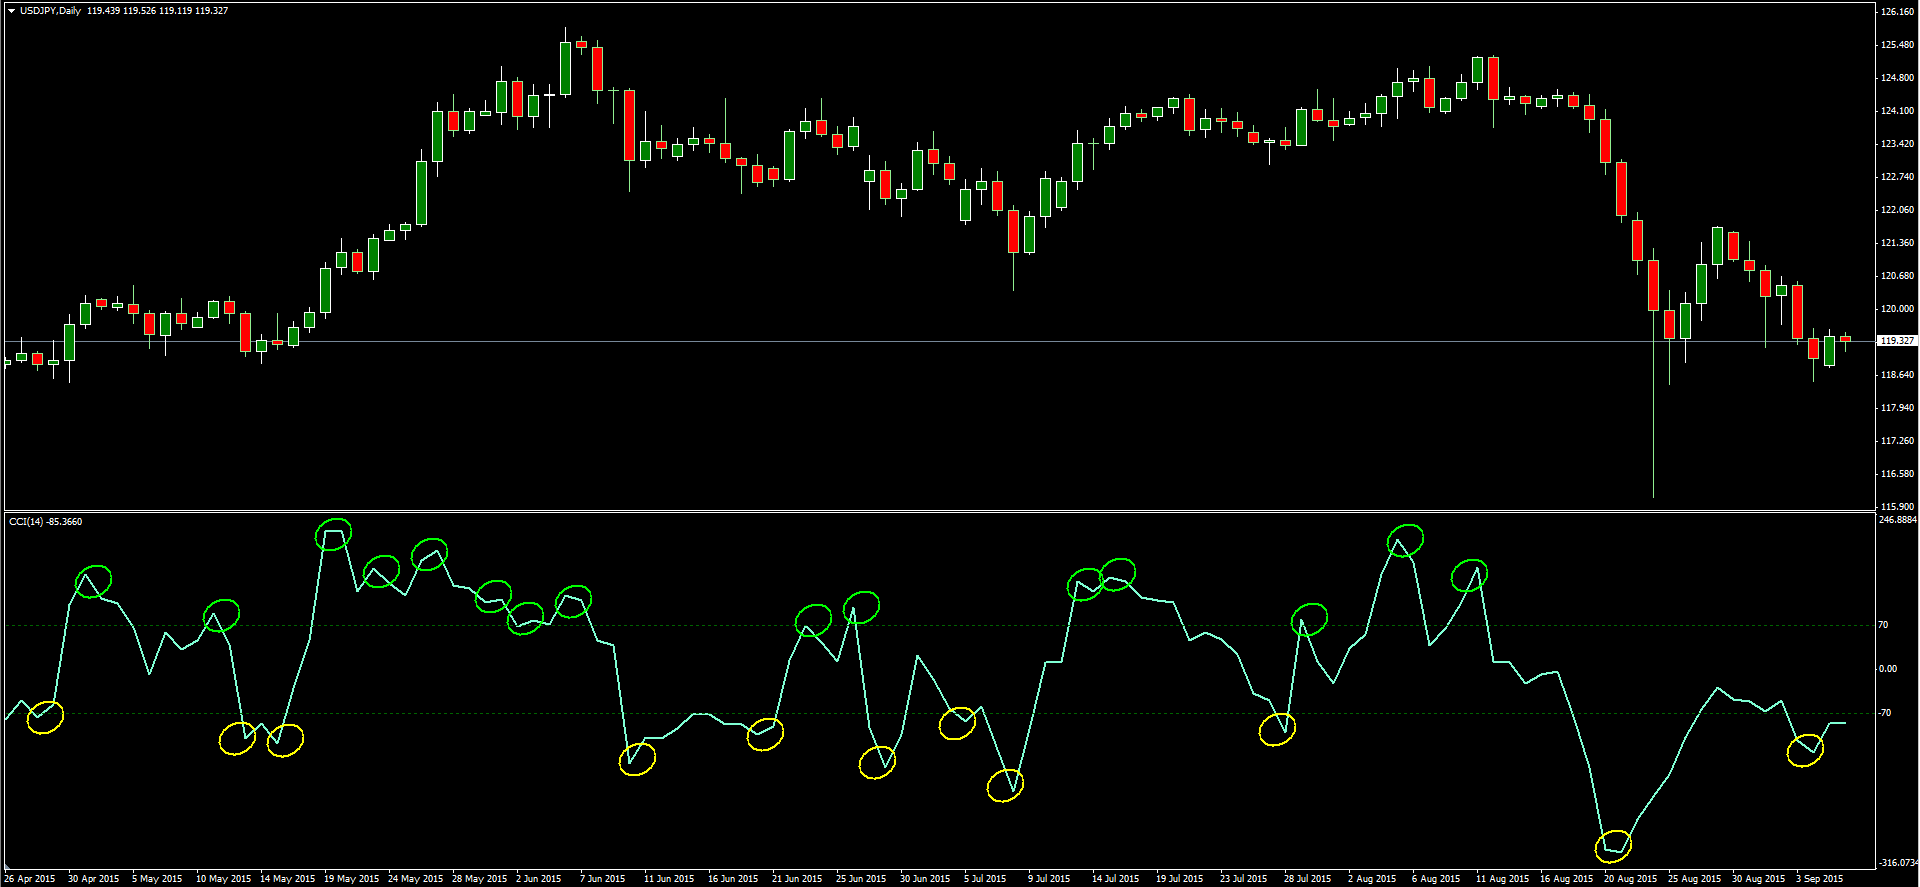
The image shows all the buy Set-ups (yellow circles) and the sell Set-ups (green circles) generated by the trading strategy for the EURUSD chart from May to Aug 2015
Technical Indicator Based Set-ups
Most technical indicators look back to calculate their present value and as such are described as 'lagging indicators'. The only way previously thought to use a lagging indicator as a potentially leading/predictive indicator was with divergence from the price action. However, this trading system shows that utilised in new and different ways the CCI indicator can also be employed by the trader as a leading/predictive indicator.
It is only high (sell) or low (buy) oscillator readings that forms the basis of the essential first component of the indicator set-ups. CCI oscillators measure momentum, so any change from price action in such an indicator suggests an exhaustion of price action in the current direction. This forms the basis of the essential first component of the indicator set-ups.
The trading system set-ups are based upon the technical phenomena of the CCI oscillator reaching high levels coupled with price action reversals, giving rise to high probability trading opportunities, and the trading edge provided by this trading system.
A 'Trading Edge' has been described as ‘…having an historically higher probability of one outcome over any other.’ To this extent all that is known about a trading edge is that historically over a sample it has repeated itself leading to over-all profitability'.
Remember, although the +70 and -70 Level Lines give the appearance of them just being arbitrarily drawn to simulate the overbought or oversold areas of the normal CCI indicator this would be the wrong idea. These level are statistically generated for optimal performance for the strategy.
Testing has shown that higher Level Lines lower the number of winning trades statistically more than the number of losing trades, while lower Level Lines indicates more trades with more winners but this is offset by an excessive increase in the number of losing trades.
Identifying potential Set-ups
The Set-up is the starting point in identifying all the potential trades of this trading strategy. To identify the Set-ups is relatively easy as Set-ups can only develop by touching or going above the +70 line for a sell trade and touching or going below the -70 lines for a buy trade.
The First Component of the Trading Strategy
Set-ups can sometimes voided by the next Set-up Below is an image of voided Set-ups Here you can see the following Set-up has finished higher than the first Set-up When this happens we ignore the first Set-up and simply use the second Set-up as the current Set-up
Instances like this can happen several times during the CCI indicators visit above/below the Level Lines before a usable Set-up can appear, as shown below.

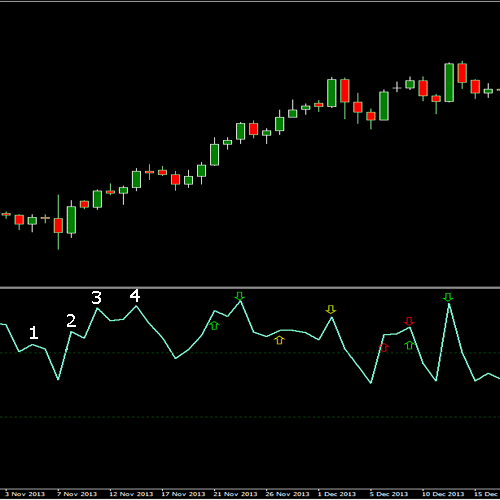
This image explains how multiple Set-ups fail. The trading strategy can get a little confusing at times
A short explanation of the image above may help. We see the first peak form (1) on the left of the image begins the start of a series of consecutive failing Set-ups.
-
The first Set-up peak (1) appears but then becomes a failed peak when the next Set-up (2) appears and ends higher on the oscillator MA line. This makes the peak at (2) the new Set-up peak.
-
However when the next Set-up peak (3) appears it again finishes higher than peak (2) making peak 2 another failed Set-up.
-
And yet again the Set-up fails at peak 3 when the new Set-up peak (4) forms.
-
The coloured arrows show that this is a common occurrence during the visit of the oscillator MA line above the 70 level line or below the -70 level line.
It may seem very confusing looking at it here however this is only because you can see all the Set-ups a once, during trading it is much easier to understand as each Set-up will appear in turn. Once you start to trade the strategy on the demo platform you will find it becomes a lot clearer.