PRIVATE FOREX TRADING FIRM
Cevntun Trading Partners
Image 2
Image 2, the GBPUSD chart as it appeared at the time of the new trading session. A retest peak opened on 10th Feb. As you can see at this time this trade appears to be just another normal Yellow (SRT) trade.

Image 1
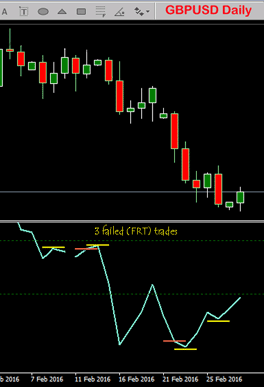
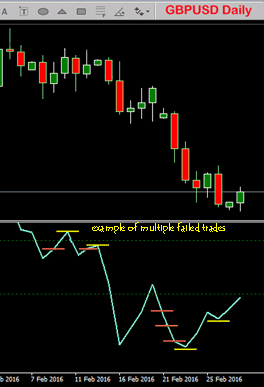
Image 1, shows several failed trades Red (FRT's) types that were created on the GBPUSD chart during this period. You will notice that each failed type is followed by a Yellow (SRT) trade. When the next Yellow (SRT) trade has opened and closed this then closes the failed trade too. Not until the next Yellow (SRT) trade has been created and closed does trading return back to normal.

By employing a Trade Management policy the number of winning trades is increased therefore the return profit can be greatly enhanced. Trade management for the Cevn Bounce trading strategy is quite simple but can cause confusion.
There is only one trade management rule for trading this part of the trading strategy and that is,
Every trade must end with a Yellow Successful Regular Trade (SRT) type.
This is true regardless of the number of Red coloured Failed Regular Trades (FRT's) that happen to precede the final Yellow (SRT). It should be noted that although the Red trades are named Failed Regular Trades (FRT's) only a few of these are actually losing trades.
Trade Management
The setup:
Image 1, below shows the session candle opened on the 10th Feb. It produced a Retest peak of the preceeding Setup peak (out of picture. Although price fell from the outset momentum failed to hold to downside and the CCI Moving Averages line began to swing up towards the then yellow line 'now the first red line. This indicated that price was looking to change to the upside. Finally going against the trade to create a failed trade.
Now we can't ignore this failed type as we have placed a trade here. So we change the line colour to Red and call it a failed trade. We must then wait for a yellow trade to open and close before the influence of the red trade is over.
The reason for changing the colour is to let us know that a trade once appeared here. Many times instances of failed retests vanish as the blue Moving Averages line continues on its path.
Image 3
Image 3, shows how the trade appeared later on in the session. The retraction of the blue Moving Averages line is a sure sign that momentum is going to turn to the upside and the trade is going to fail.

Image 4
Image 4, the Moving Averages line has now retreated well past the yellow line and the trade has completely failed as momentum swings against the trade. We now need to change the Yellow (SRT) line for a Red (FRT) line, then wait for the next Yellow (SRT) trade to open and close before this Red (SRT) is closed.


Image 5
Image 5, the Moving Averages line has now retreated well past the yellow line and the trade has completely failed as momentum swings against the trade. We now need to change the Yellow (SRT) line for a Red (FRT) line, then wait for the next Yellow (SRT) trade to open and close before the Red (SRT) is closed.
Remember, all the Red (FRT) trades are closed when the next Yellow (SRT) trade closes, regardless of the number of failed that preceed the Yellow trade.