PRIVATE FOREX TRADING FIRM
Cevntun Trading Partners

The CCI Oscillator Screen

The first thing you need to understand with this trading strategy is the unique way it employs the CCI indicator screen. To those not aware of how the CCI indicator works there is no need to learn how to use it for this trading strategy.
The CCI indicator normally has three sections; above +100, below -100, and a central section. Each section is important in normal usage of the CCI indicator and each section can have an effect on how to trade the oscillator.
The normal view of the CCI indicator screen
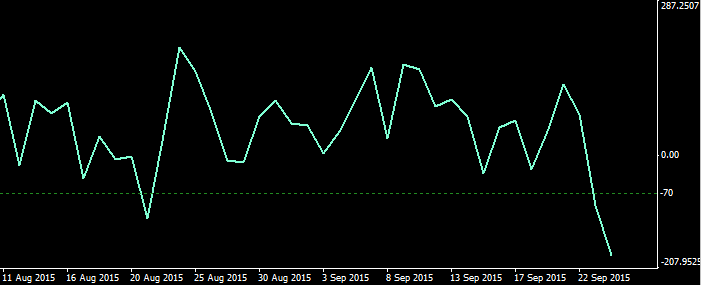
Normal view of the CCI indicator screen for the Cevn Bounce
While both screens appear to be exactly the same but with just a small difference, the Cevn Bounce Level Lines appear to have simply been moved to +70 and -70 rather than +100 and -100.
However this is not the case,
-
there are no overbought, oversold or central areas associated with this strategy.
-
there are only two sections for a buy trade above and below the +70 Level Line.
-
there are only two sections for a sell trade below and above the -70 Level Line.
-
and you do not trade the CCI oscillator as with a normal CCI trade.
It is very important you understand the concept behind the CCI indicator screen as it is the basis for the whole strategy. This area can cause much confusion that is why the trader must understand the following concept fully. Traders must ensure they make themselves completely comfortable with the concept of a redesigned CCI screen.
The CCI screen rules are very simple, in a nutshell they are;
-
Picture the screens as below, with just one Level Lines on the screen at a time. So for a buy trade there would be only the -70 Level Lines on the screen. And for a sell trade there will only be the +70 Level Lines on the screen.
-
So during a sell trade there are only two sections shown on screen (see below), they are above the +70 and below the +70 line. Always try to remember that when a sell trade has been triggered the section below the -70 line will have no effect on that trade as there is no overbought area.
-
And during a buy trade there are only two sections shown on screen (see below), they are above the -70 and below the -70 line. Try to remember that when a buy trade has been triggered the section above the +70 line will have no effect on the trade as there is no oversold area.
While I agree that the rules appear not to difficult to understand and of course they are not, due to the way they are displayed on the screen as shown above, can cause new traders at times to forget and treat the CCI indicator as normal.
What you must comprehend is that it is not the learning of the rules that causes the most problems, but when it comes time to place trades, it can then get slightly confusing if you are not fully comfortable with the concept. So the more competent you are with the rules the less confusion you will have when trading live. Regular use on demo accounts by the trader will aid greatly in their ability to trade the system correctly.
How the trader should imagine the CCI indicator screen during a buy trade
And how the trader should imagine the CCI indicator screen during a sell trade

